
When revisiting Mixmode API eliminating data over-fetching was one of the key areas that we focused on for our 6.1.8 release.
By reducing the amount of initial metadata returned in response to PQL (PacketSled Query Language) queries we are able to return an unlimited number of flow entries.
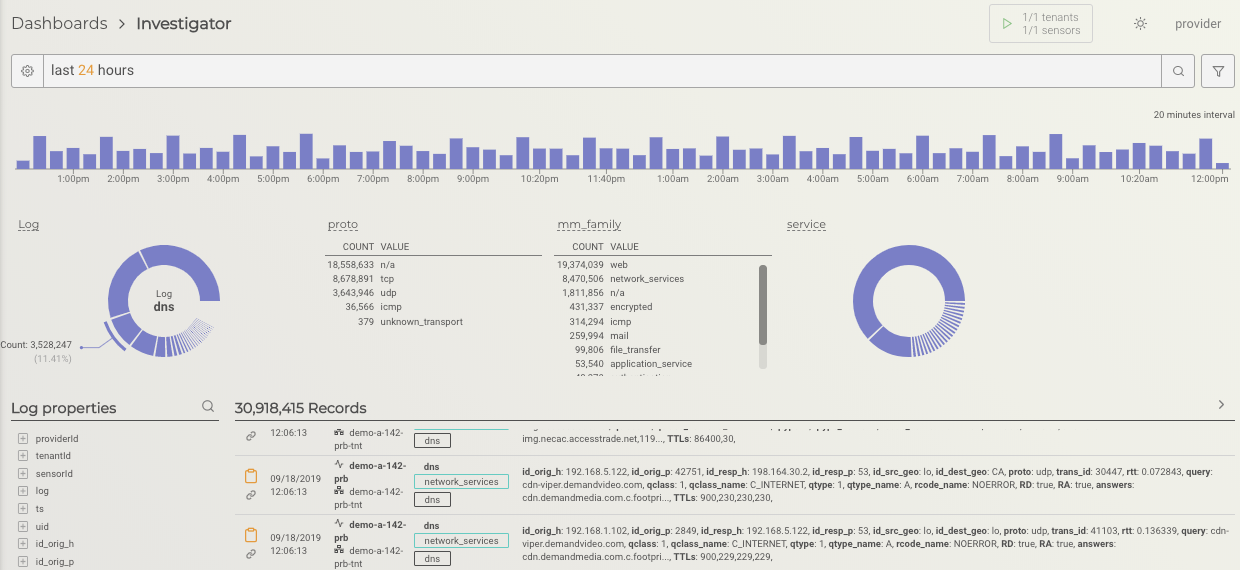
According to Senior Software Engineer Ante Kalajzic, “Dashboard was never really interested in the full logs to show all it needs to show: time chart shows just count of logs per interval ‘bucket’, widgets show count of any given attribute in the result set, and it was only the actual table of logs that wanted to show more details about each log, but even the record table only had a few dozen of logs in the viewport at the time.”
These changes work together with MixMode API improvements which allow the client to directly ask for counts of any log property (or counts for time intervals), which significantly reduced the payload being sent from the API, and parsed on the client.
The MixMode User Interface has been reworked to heavily utilize this capability of our API by sending out several much smaller requests. Time chart asks for count by time interval countby @minute, widgets ask for count by log property they are interested in countby propKey, and table of logs asks for a limited results of a full logs limit 100, and is paginated from that point.
This results in significant reduction of traffic being sent from the backend to the client, allowing for a complete time range being requested (which can be tens of millions of logs).
In addition to these investigator enhancements we also took the opportunity to add some more features into the dashboard:
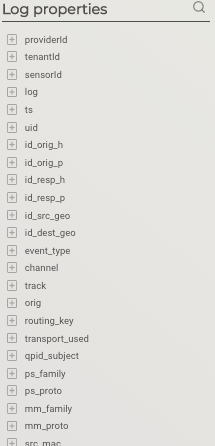
Log properties is a list of all potential properties users can select to create widget from. Since the list is pretty large, clicking on the magnifying glass will allow for searching for properties, and clicking on one will make a quick call against the API and show a preview of values of a property within given PQL. This allows the user to get a better sense of what is going on in the logs, without having to create widgets in the dashboard, if the user doesn’t desire to.
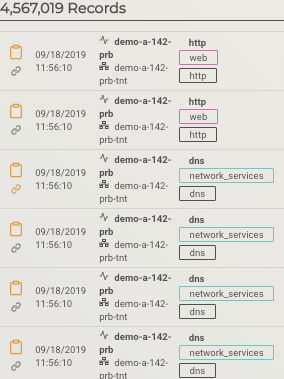
Record table also had a small feature improvements, based on the user feedback, in which we’re surfacing now color coded proto/family values, and there’s a small link that would make a PQL query which effectively shows connected logs to the one being selected (flow). While the changes on the record table are small on the surface, our new version allows for much easier improvements on it in the future, like allowing users to define their own table columns and such.
See how MixMode provides the most advanced multi-stream network security analytics and predictive threat detection across any data stream. Schedule a demo today.
MixMode Articles You Might Like:
Improvements to MixMode’s PQL: Packetsled Query Language
4 Ways to Protect Your Business from Zero-Day Attacks
Anomaly Detection with Unsupervised AI in MixMode: Why Threat Intel Alone is Not Enough
The Difference Between Artificial Intelligence and Machine Learning in Network Security
Unsupervised AI as a Service: Predictive Intelligence for Cybersecurity